Statistics in Marketing - Discrete Probability Distributions


This is first of a series of articles where I explore how knowing statistics can be helpful to a digital marketer in a simplified view.
Through this writing journey, I hope I can inspire you to take another look at your campaign metrics and discover what story or insights are they telling you. In this article, I will cover discrete probability distributions, and you can find out about continuous probability distributions here.
Knowing Probability as a Marketer
As an analyst/ marketer, often you will be looking at a lot of data generated during campaigns. Some of the data sets may be discrete, while others may be following a continuous distribution. With the numerous types of data distributions, it is important to have a good understanding of the common types and what are the situations where you are likely to see one.
Discrete vs Continuous Variables
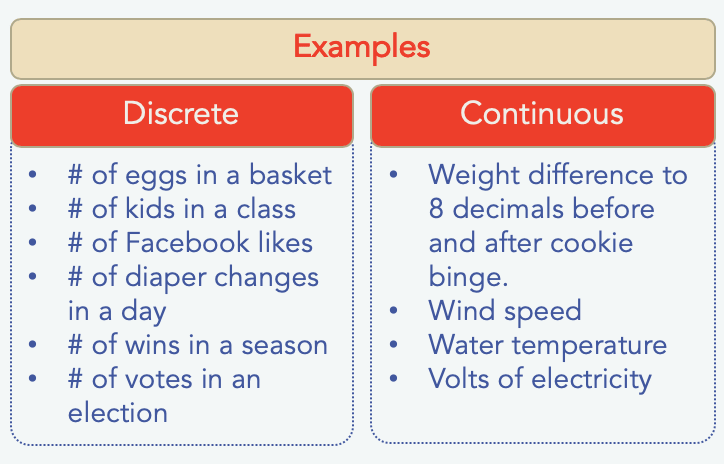
For the different distributions which I will cover in these articles, they are classified as either a Discrete Probability Distribution or Continuous Probability Distribution. A simple way to understand if your data is discrete or continuous is to answer the following question: “Are the number of your outcomes finite?"
If the answer to the above is yes, then you have a discrete dataset. Otherwise, you likely have a continuous dataset.
To put things in a marketing perspective, imagine that you are looking at the number of likes that your Facebook campaign generated, you know that likes are finite because you count the number of likes as 1,2,3, …100, there is no chance of getting a 1.2 or 2.6 likes or other smaller value that isn’t exactly 1 or 2. These outcomes are a set of values rather than a continuous length of values.
Example of a continuous distribution would be the profit margin from your online store. On any given day, the store may report that it’s profit margin is $320. The actual profit margin may not be exactly $320. It could be $320.60, $320.06, or even $320.31415. All these values are different from the other and as such as referred to as a continuous range of values.
Examples of Discrete Probability Distributions
Common examples of discrete distributions includes, Discrete Uniform Distribution, Bernoulli Distribution, Binomial Distribution, Poisson Distribution.
Discrete Uniform Distribution
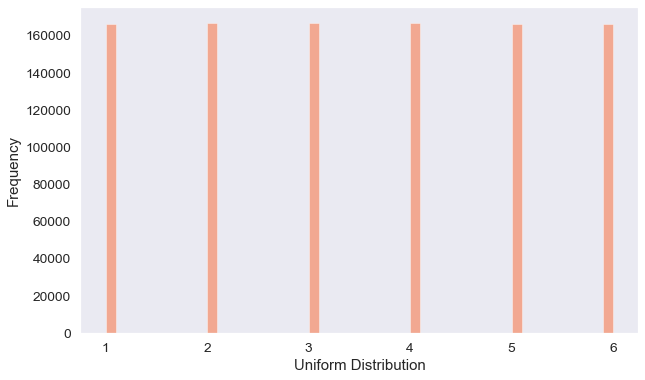
The Discrete Uniform distribution essentially represents that every one of the n values has an equal chance of being observed. Imagine if you roll a fair dice, the possible values are 1, 2, 3, 4, 5, 6, and each time the die is thrown the probability of a given score is 1/6.
Bernoulli Distribution
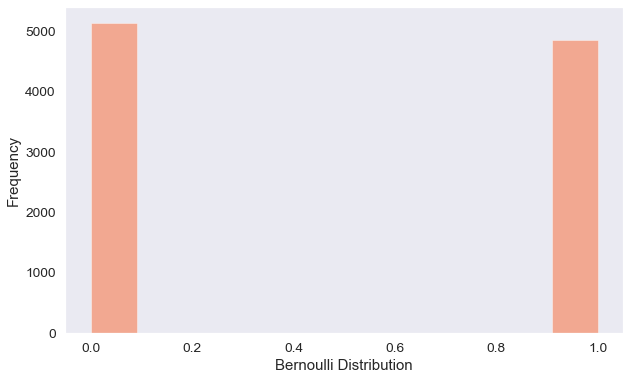
The Bernoulli distribution represents the probability of binary output to a trial. The chart above shows an example of presenting someone with a newsletter subscription page, where the 2 outcomes (subscribe “1”/ did not subscribe “0”) have a 50% probability of occurrence.
Now, the idea behind the Bernoulli distribution is that the experiment is repeated only once. But what happens if we run more than one trial, under the assumption that trials are independent among each other?
Binomial Distribution
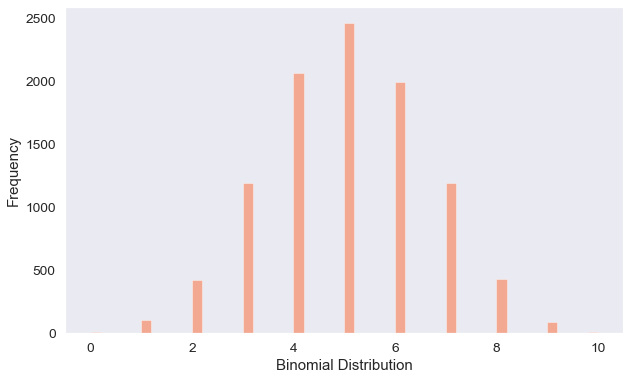
The answer to that question is the Binomial distribution. This distribution describes the behavior the outputs of n number of random trials, with the probability of success for all trials being the same.
Expanding on the earlier Bernoulli distribution, this time our marketing team will run 10,000 trials, where 10 random people will be presented with the same newsletter subscription page, having the assumption that there’s a 50% chance of people subscribing.
After gathering the response from those trials, we observed the above Binomial distribution where there is a high count of 4-6 subscribers to our newsletter in each trial, with less than 3 and more than 7 subscribers less observed.
Poisson Distribution
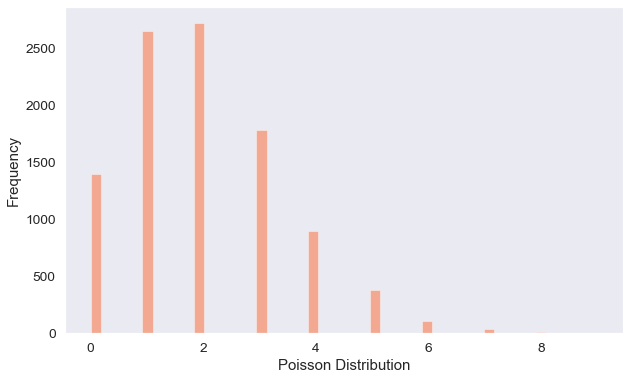
Poisson Distributions are commonly used to show the number of times an event might occur in a fixed time interval or space.
One example of Poisson distribution will be the number of visitors to a website. Say for example if we are to monitor over 10,000 hours, the number of visitors per hour to a personal website, we would get the above Poisson distribution which tells us that we are very likely to get 2 visitors per hour.
Use case of Binomial Distribution and Poisson Distribution
If an average probability of an event happening per unit time is given, and you are asked to calculate a probability of n events happening in a given time, then the Poisson Distribution is used. (eg: If we know that our website get 2 visitors per hour, what is probability of the website getting 20 visitors in 12 hours?)
On the other hand, if an exact probability of an event happening is given and you are asked to calculate the probability of this event happening k times out of n, then the Binomial Distribution is used. (eg: We know 50% of the site’s visitor are newsletter subscriber, if 10 random site visitor are being selected, what is probability that exactly 7 are subscriber?)
End Notes
I hope this article provided you with an overview to some of the discrete probability distributions that you may come across when analyzing marketing campaign data. In my next article, I will touch on continuous probability distributions.